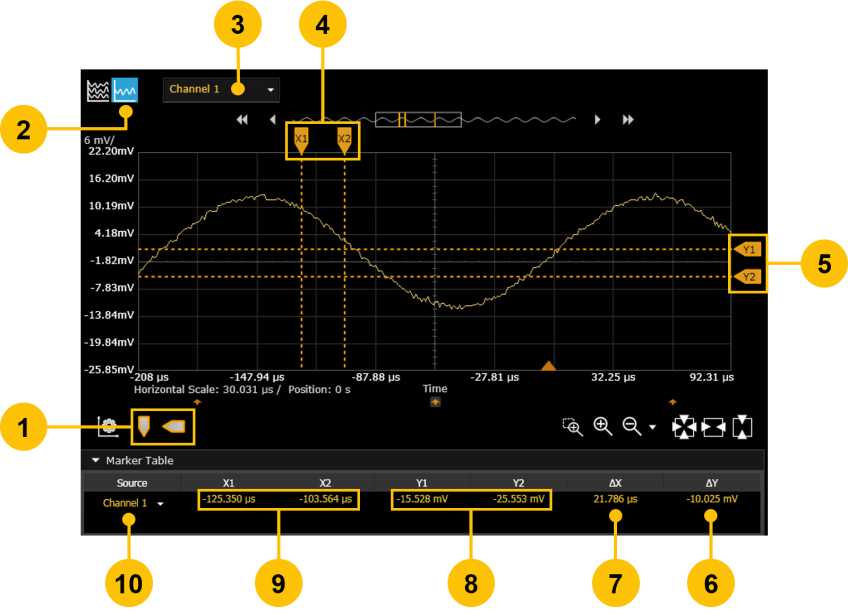
In the Single Chart view only, you can position two vertical and two horizontal markers for deeper analysis of the selected trace. You can position each set of markers (vertical, horizontal, or both) to display the relative measurement data between the markers (∆X1-X2 and ∆Y1-Y2). When enabled, markers appear on the chart as sets of two vertical and two horizontal dashed yellow lines as shown below.
To select the desired trace to be displayed in the chart, use the drop-down list next to the Single Chart icon or in the Marker Table below the chart under the "Source" column. Drag the dashed lines to the desired vertical or horizontal position. The resulting measurement data is shown in the Marker Table drop-down.
| 1 | Click to toggle vertical or horizontal markers on or off. | |
| 2 | Markers are available in the Single Chart view only. | |
| 3 | Select the desired source trace (see also #10 below). | |
| 4 | Vertical markers (time axis) are labeled X1 and X2. Drag the dashed lines left or right to the desired position. | |
| 5 | Horizontal markers (amplitude axis) are labeled Y1 and Y2. Drag the dashed lines up or down to the desired position. | |
| 6 | The relative difference (∆) between the Y1 and Y2 horizontal markers. | |
| 7 | The relative difference (∆) between the X1 and X2 vertical markers. | |
| 8 | The current values for Y1 and Y2 horizontal markers. | |
| 9 | The current values for X1 and X2 vertical markers. | |
| 10 | Select the desired source trace (see also #3 above). |